
How to Build a Logistics KPI Dashboard: The Metrics Indian Manufacturers Actually Track
Key Highlights
- A logistics KPI dashboard turns scattered freight data into one live view of cost, service, and compliance.
- India's logistics cost is now estimated at 7.97% of GDP, making efficiency tracking a board-level priority.
- RoaDo’s automated auditing helps manufacturers achieve a 65% faster billing cycle.
- A dashboard is only as good as its data source, so the automated feed matters more than the chart.
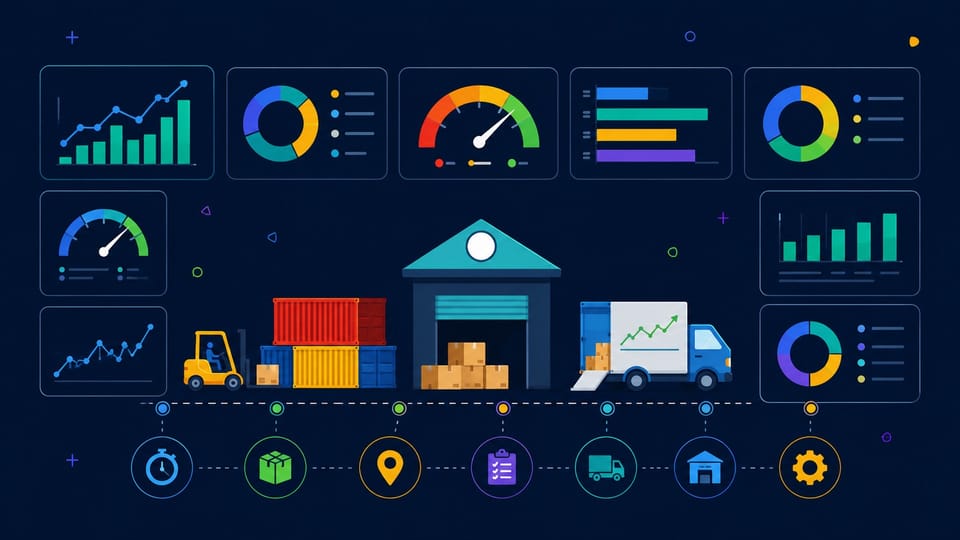
What Is a Logistics KPI Dashboard?
A logistics KPI dashboard is a centralized view of your freight data that shows how your operation is performing against the metrics that matter most. Instead of relying on multiple spreadsheets and email updates, teams can monitor shipment performance, costs, and service levels in one place. The goal is not to track every metric, but to focus on the KPIs that drive decisions and highlight issues early enough for corrective action.
For Indian manufacturers, this has moved from a nice-to-have to a priority. The government's first systematic assessment places India's logistics cost at 7.97% of GDP, or roughly ₹24.01 lakh crore for 2023-24. When logistics accounts for such a large share of the economy, even a small efficiency gain on your own freight spend, from indent allocation to final delivery, is real money. You cannot capture it if you cannot see it.
A metric is any number you can measure. A KPI is a metric tied to a goal. Kilometers driven is a metric. On-time delivery against a 95% target is a KPI because it tells you whether you are winning or losing.
Which Logistics KPIs Should You Actually Track?
Fewer than most teams think. The mistake is loading a dashboard with twenty metrics nobody reads. A strong logistics KPI dashboard usually answers four questions: are we fast, are we reliable, are we cost-efficient, and are we compliant? Pick a small set of transportation KPIs that map to those questions and ignore the rest until they earn a place.
In the Indian context, the following metrics form the North Star for supply chain leaders:
- On-Time Delivery (OTD): This measures the reliability of your carriers. A 95% rate is a common industry benchmark.
- Freight Cost per Shipment: This measures the cost efficiency of moving goods. It is calculated by dividing total freight cost by the number of shipments, surfacing where spend is leaking.
- Average Transit Time: This flags route and carrier delays by measuring the speed from pickup to delivery.
- Freight Bill Accuracy: This tracks billing and audit quality. It is a critical metric because RoaDo users consistently report that automating this audit leads to a 65% faster billing cycle
- Vehicle Utilization: This identifies empty miles and waste by comparing capacity used versus capacity available.
Cost, Service, Efficiency, and Compliance
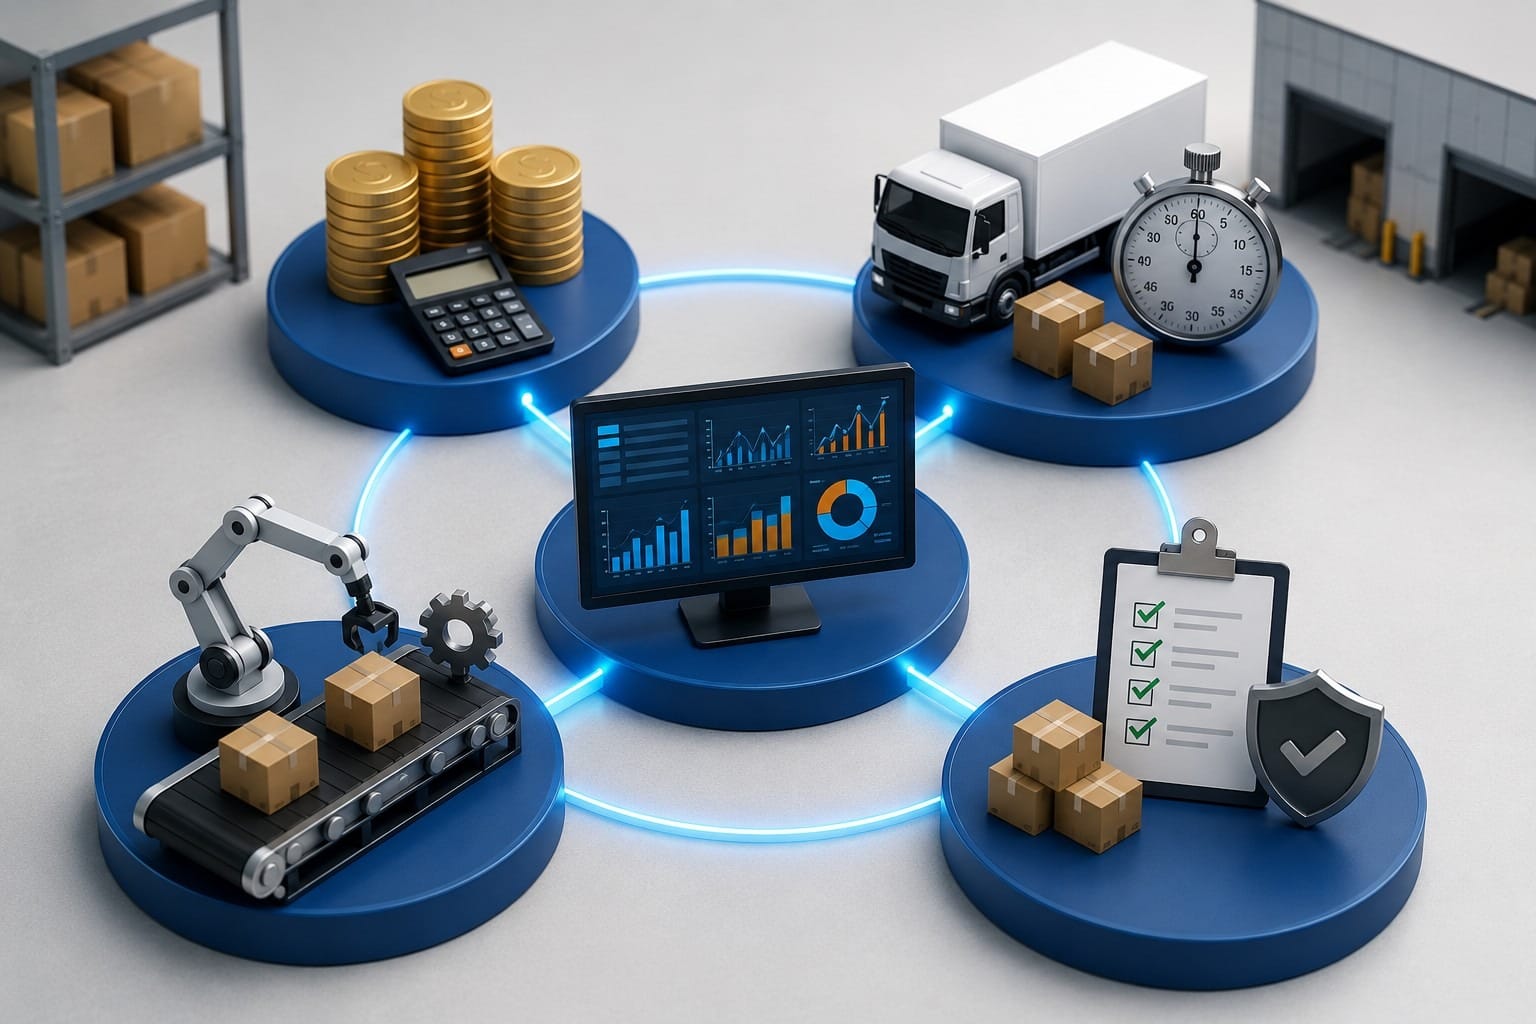
Group your metrics by the question they answer, and the dashboard organizes itself. Cost metrics like freight cost per shipment tell you where money goes. Service metrics like on-time delivery tell you whether customers are happy. Efficiency metrics like vehicle utilization tell you whether assets are working hard.
Compliance metrics, which matter sharply in India, tell you whether documentation like e-way bills is in order before it becomes a penalty. For manufacturers managing large fleets, this is a major financial risk.
Platforms like RoaDo integrate directly with VAHAN and GSTN portals to automate these checks. This proactive monitoring helps manufacturers save over ₹20 crore in potential penalties every day by ensuring every vehicle has a valid permit, insurance, and e-way bill before it hits the road.
OTIF means "on-time in full." A shipment only counts as a win if it arrives both on time and complete. Large buyers often penalize anything that misses either part, which is why OTIF is stricter than plain on-time delivery.
Building the Dashboard: From Raw Data to a Single View
Start with the decision, not the chart. The build sequence is simple: define the few KPIs that drive your decisions, secure a reliable data feed for each, set a target, and only then visualize. Most teams reverse this and start by designing pretty charts on top of data they cannot trust.
The hardest step is the data feed. A freight metric is only useful if it arrives automatically and accurately. If someone has to key in delivery times by hand, the dashboard is stale before it loads. This is where the source system matters. A Freight Operating System (FOS) like RoaDo can supply this layer by capturing trip, delivery, and billing data directly.
What makes this particularly effective for the Indian market is RoaDo's hardware-free tracking. Most third-party transporters are hesitant to install expensive GPS devices. RoaDo overcomes this by using SIM and browser-based tracking, which does not require any hardware installation on the truck. This ensures that your KPI dashboard is fed with real-time data from 100% of your shipments, not just the ones with specialized hardware.
How to Implement Your Dashboard Step-by-Step
To reach a professional level of visibility, follow these five implementation steps:
1. Data Integration (The Foundation)
Connect your ERP (like SAP, Oracle, or Tally) to your Freight Operating System. The ERP holds the orders while the FOS holds the execution data. By linking them, your dashboard can track the time from Order Placed to Order Delivered, a metric known as Order Cycle Time.
2. Establish Baselines
Before setting aggressive targets, look at your last three months of data. If your average OTD is 82%, setting a 98% target for next month will only demoralize the team. Use your freight operating system to pull historical trends.
3. Define Access Levels
A logistics manager needs to see carrier-wise performance to negotiate better rates. A plant manager needs to see gate-in/gate-out times to manage labor. A CFO needs to see DSO (Days Sales Outstanding) and freight spend vs. budget. Build your dashboard with filters so each persona sees what they need.
4. Automate the e-POD Collection
One of the biggest black boxes in logistics is the time between delivery and the return of the physical proof of delivery (POD). By using a digital POD (e-POD) system, you can update your Billing Readiness KPI instantly. RoaDo’s e-POD automation has been shown to reduce DSO by 7 - 10 days, significantly improving company cash flow.
5. Set Real-Time Exception Alerts
A dashboard is reactive; an alert is proactive. Configure your system to send a WhatsApp or email alert when a KPI falls below a threshold, for example, if a high-priority shipment has been stationary for more than 4 hours.
Why Do Most Logistics Dashboards Fail?
Most logistics KPI dashboards fail for three common reasons: poor data quality, tracking metrics that do not support decision-making, and the absence of clear performance targets.
A dashboard built on manual spreadsheets drifts out of date. One stuffed with metrics nobody acts on becomes wallpaper. And one without targets tells you what happened, but never whether it was good or bad.
The fix is discipline on all three. Automate the data so it is current and accurate. Cut any metric that has not driven a decision in a quarter. Attach a target to everything that remains. The payoff is direct, especially given the cost pressure Indian manufacturers face as the country works to keep logistics costs competitive.
A dashboard that flags a slipping on-time rate or a creeping freight cost per shipment in real time lets you act while the issue is still small. Pairing the dashboard with a system that also automates compliance keeps the compliance column green without manual chasing. This is the difference between managing logistics and orchestrating a supply chain.
Conclusion
Most logistics teams are not short on data; they are short on a clear, trusted view of the few numbers that decide whether freight is fast, reliable, cost-efficient, and compliant. The real lesson in building a logistics KPI dashboard is that a handful of well-sourced metrics will always beat a wall of charts running on messy spreadsheets.
Start with the decisions you need to make, secure clean automated data behind each KPI, and attach a target so every number means something. As India drives its logistics costs toward global benchmarks, the manufacturers who measure tightly will be the ones who act fastest.
Frequently Asked Questions
- What is a logistics KPI dashboard?
It is a single, often real-time view that shows your key freight and supply chain metrics against their targets. - What are the most important logistics KPIs?
On-time delivery, freight cost per shipment, average transit time, and freight bill accuracy are the core ones most operations rely on. - What is a good on-time delivery rate?
An on-time delivery rate of 95% or higher is a common industry benchmark. - How do you calculate freight cost per shipment?
Divide your total freight cost by the number of shipments over the same period. - What is the difference between OTD and OTIF?
OTD counts deliveries that arrive on time, while OTIF requires them to be both on time and complete. - Can I build a dashboard without GPS hardware?
Yes. Modern freight operating systems like RoaDo use SIM-based and browser-based tracking to provide the real-time data needed for dashboards without physical devices. - How does a dashboard help reduce logistics costs?
It identifies inefficiencies like excessive detention, empty miles, and billing errors, allowing you to fix them before they escalate.
“Start tracking the logistics KPIs that matter with RoaDo and gain complete visibility into your freight operations today."